
%201.svg)


Audit every fee. Understand every cost. Improve every account
Swipesum Audit, formerly Staitment, is merchant statement analysis software for platforms, ISOs, and merchants. It analyzes payment processing statements to turn fee and pricing data into cost comparisons, interchange insights, issue detection, and optimization opportunities across individual accounts or entire portfolios.
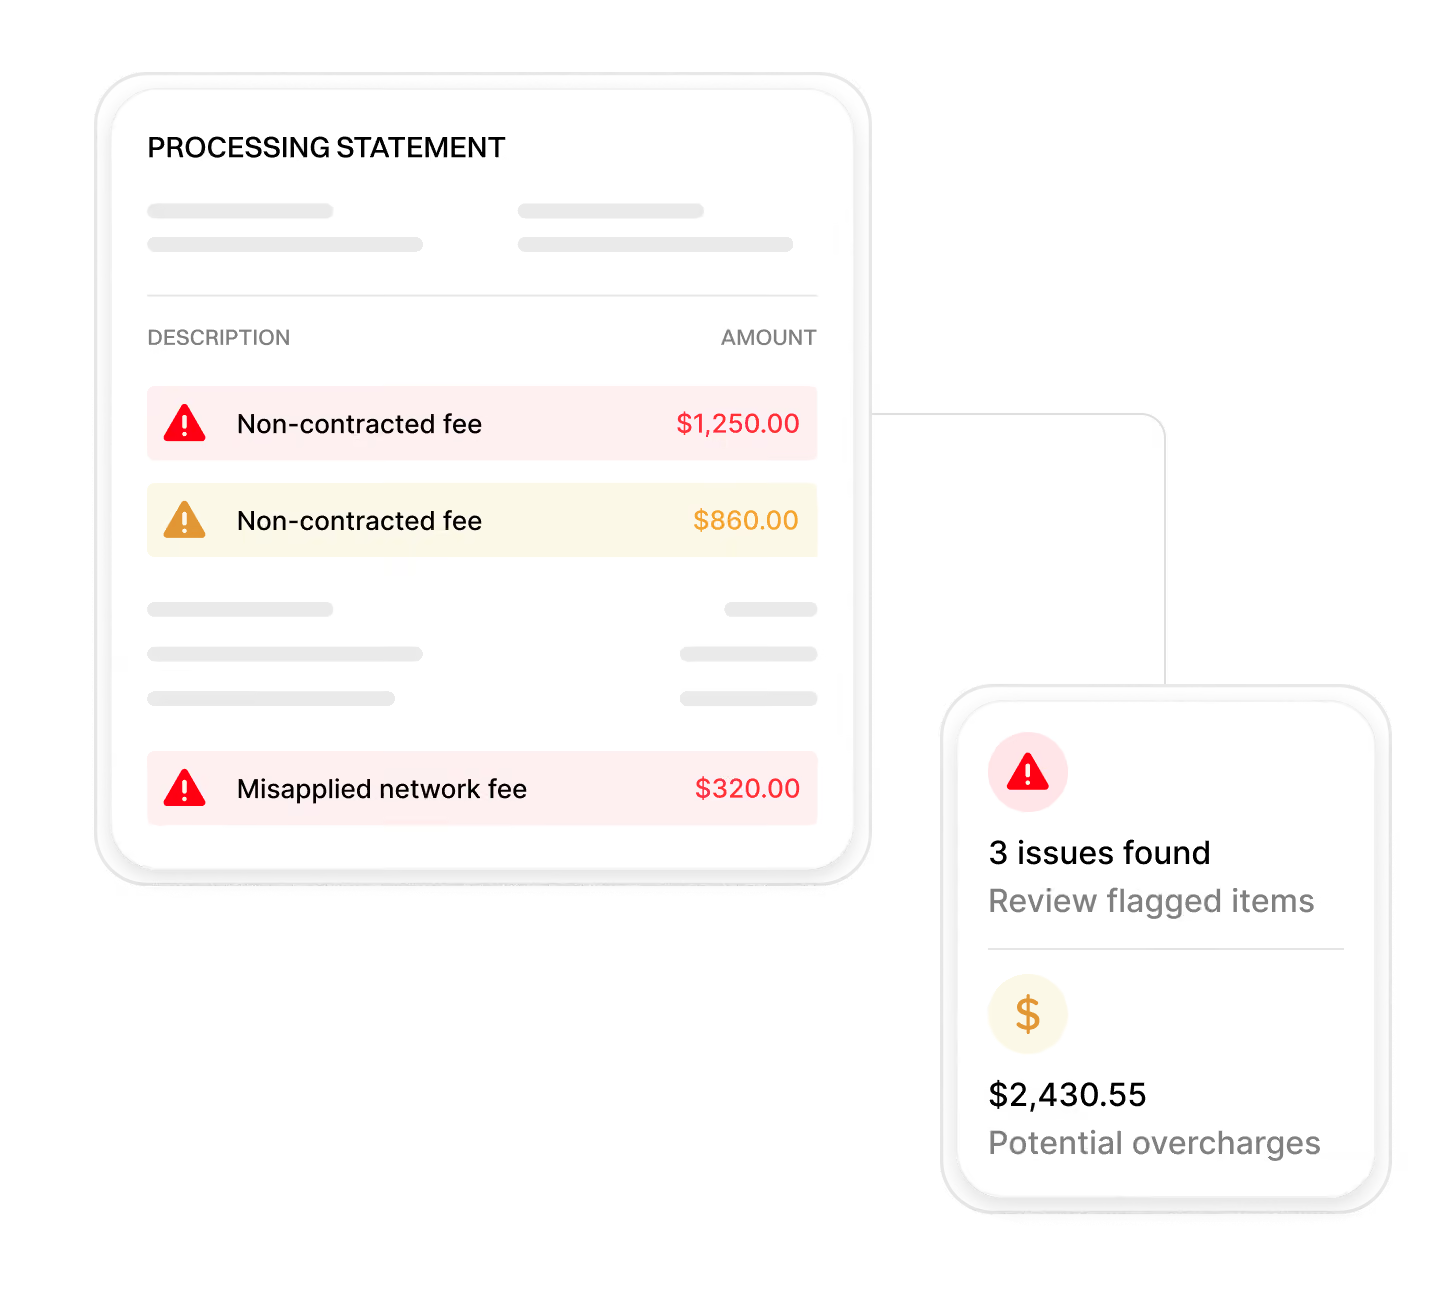


















Understand what you’re actually paying
Every fee is parsed, categorized, benchmarked, and analyzed so teams can see where payment costs are coming from.
.avif)
Find hidden costs and inconsistencies
Identify hidden fees, pricing inconsistencies, and unexpected charges across your statements, with full transparency into where your money is going.
PROCESSOR MARKUPS
Identify excessive network-related fees and inconsistencies across payment statements.
Processor Pricing
Markup:
1.92%
Annual Impact:
$14K
NETWORK FEES
Identify interchange downgrades and higher-than-expected processing costs.
Network Compliance
Network Fees:
18%
Invalid Mappings:
17
INTERCHANGE FEES
Identify interchange downgrades and pricing inefficiencies.
Interchange Audit
Interchange Rate:
1.78%
Potential Savings:
$3.2k
NON-CONTRACTED FEES
Surface charges outside your agreed pricing structure.
Contract Compliance
Unexpected Fees:
1.24%
Annual Impact:
+$2,840
EFFECTIVE RATE DRIFT
Monitor gradual increases in effective processing rates over time.
Rate Monitoring
Effective Rate:
2.41% → 2.87%
Rate Increase:
+0.46%
HIDDEN FEES
Detect duplicated, unexplained, and irregular billing charges.
Billing Audit
Hidden Charges:
12
Potential Savings:
$4.8k
Negotiated pricing only matters if it shows up on your statement
Swipesum Audit compares billed pricing with expected or negotiated terms so teams can spot markup drift, pass-through differences, and fees that do not match the agreement.

Your effective rate should stay flat, not creep up.
+0.41% vs contracted rate

Your effective rate should stay flat, not creep up.
Total Drift
Additional Cost / month
Trend

From upload to actionable insights
UPLOAD
Upload your processing statement securely.
Parse
Swipesum Audit analyzes and structures the statement data.
Audit
Fees, rates, and anomalies are identified.

Compare
Compare processing costs and pricing across accounts or proposals.
Insights
Get clear recommendations and findings.
Built for ongoing audits. Not just one-time analysis.
Swipesum Audit supports recurring statement reviews across merchants, portfolios, and accounts, helping sales, finance, and operations teams track pricing, fees, and optimization opportunities.
.avif)
Audit results in the real world
See how Swipesum used location-level payment analysis to identify $86.6K+ in monthly savings opportunities across the FASTSIGNS franchise network.
Caleres enterprise payment optimization
What can an enterprise retail payment audit uncover?
~$1.6M modeled
Annual cost savings
Case Study

FASTSIGNS franchise payments rollout
How do you scale integrated payments across a franchise system without losing local adoption?
~$1.04M identified
Annual cost savings
Case Study

Plumbers Supply B2B payment optimization
How can B2B distributors lower commercial-card processing costs?
$10K+
Annual cost savings
Case Study

Upload your statement and see what you’re paying
Get a detailed audit of your processing costs and uncover opportunities to reduce fees.

Start with a free statement audit
Upload your statement on the next page. Our payments team will follow up with your findings.
Request a Statement Audit
What you can do with Swipesum Audit
Swipesum Audit provides statement analysis, processing-cost comparisons, account review, fee visibility, and optimization monitoring across merchants and portfolios.
AUDIT STATEMENTS
Analyze uploaded statements and identify pricing inconsistencies, markups, and hidden fees.
24 fee categories analyzed
COMPARE COSTS
Compare rates, fees, and processing costs across providers, accounts, and portfolios.
Benchmark variance detected
IDENTIFY HIDDEN FEES
Detect non-contracted charges, billing inconsistencies, and unexpected processing costs.
12 hidden charges found
BENCHMARK PRICING
Benchmark pricing against expected processor, interchange, and network fee structures.
0.28% above benchmark
GENERATE REPORTS
Generate audit summaries and optimization reports for teams and stakeholders.
Weekly recurring reports
SUPPORT SALES TEAMS
Help sales teams identify savings opportunities and strengthen pricing conversations.
Potential savings: $14k
MONITOR ACCOUNTS
Track recurring audits, account changes, and ongoing pricing behavior over time.
38 monitored accounts
OPTIMIZE PORTFOLIOS
Monitor portfolios and identify optimization opportunities across multiple merchants.
Portfolio variance reduced